
I had read a lot about the temperature profile I should expect under ground. I had also read a lot about how water percolating down toward the water table would rob the soil of its heat or wick it away (depending on the book). I had seen thermal resistance and other soil properties for “average soil”, but I didn’t have any really good data on how my soil (SnC) behaved. The one thing I had was a lot of time before I would get to build, so I decided to conduct an experiment on my own property.
Thanks to a late start on construction, it has now been in the ground for over a year and the results are pretty clear.
1) Soil temps at various depths were similar to an averaging of the air temperature over a period of time. More specifically, the temperature at about a 10 ft depth would be similar to the average of the past 6 months.
2) Rain water, percolating down thru the soil towards the water table, would periodically rob the soil of heat.
I decided to purchase a number of thermal and moisture sensors and bury them in order to track the temperature changes at depth. The experiment would also compare earth protected with an umbrella (dry earth) against soil that had not been protected (control). This should give me a grid of interesting data.

A schematic of the Soil Temperature Experiment, actually, I had hoped to go deeper, but this was all I could manage with my “free” method.
I looked into hiring someone to excavate and drill the holes, but it was prohibitively expensive, so I elected to dig it myself. I got to the site the first day on the way home from work and dug about 90 square feet (1 ft deep) in just about an hour (my sandy loam soil (SnC) is very easy to dig by hand). I had intended to get to about 400 square feet, and I needed to get the sensors as deep as possible, so the next time I went on a Saturday and I took a helpful friend (Aaron).
A few hours in to digging, we realized that we still had to drill the holes and then put the dirt back (the pile was pretty large by that point). As the area got larger, it was also getting harder and harder to get the dirt all the way over to the pile. We decided that roughly 14ft x 16ft was large enough (just over 224 square feet) for the experiment.
Instead of trying to dig down to bury the sensors, we had brought a couple 10 ft. cast iron pipes and some couplings. We pounded the pipes into the ground with a hand held pipe driver. The plan was to pound the first one in, and then add the coupling and the second pipe to drive it the rest of the way. However, the couplings could not handle the strain and we broke every one of them. Eventually, we realized that we had no choice but to settle for 11 ft deep holes. This was the depth of the excavation, plus the fully buried 10 ft pipe. We found that it was best to drive the pipe a couple feet, then work it out again, then drive it a couple more and work it out again until we had the pipe fully into the ground. We later realized that we actually needed to dig about another ft down so we could have enough pipe exposed to pull it out again. Final depth was about 11 ft. Fun times ;^).
We then placed the 3.5 mil polyethylene sheet, tapered down away from the “control” experiment and down toward the longer direction to channel the water as far from the experiment as possible. We were only simulating the waterproofing, and did not include any insulation. Eventually (after the onset data logger was hooked up) we filled in the dirt again (slowly, very slowly, as we were pretty tired by then).

Aaron helping me put a couple hundred cubic feet of earth back over the plastic umbrella, we did end up pulling it straighter than it appears here (to prevent pooling).
The ONSET data logger is very easy to use, so we just pounded one of the 10 ft pipes into the ground about half way down (as a post) and about half way between the two experiments. We bolted the data logger to the post, and then plugged in all the sensors. The sensors had all been labeled as they were placed so it was pretty easy to setup and configure the data logger. I did that while Aaron started to fill in the hole (not as easy).

Sensors are easily plugged into the Onset data logger
The above ground air temperature and relative humidity sensor needed to be protected from direct sunlight and rain, but without creating some artificially warm green house effect. I ended up protecting it with some white plastic cups, drilled with many holes to allow for air flow. I then wrapped that all up with a tomato cage (rabbit protection) and burlap. The rocks around the base just keep the burlap in place. I have checked the temperature every time I download data and it is never more that a degree above my hand held thermometer. However, when I compare some of the days, such as one that showed 104°F in my experiment, with the official high for that day, my experiment may have been off by 2 degrees. I think perhaps the inverted cup does contain some heat.
To download the data, I plug in my laptop and “Read out device”. Easy as pie.

- A photo of my actual setup (ONSET Data Logger). The dirt on the right is bare because I had to dig out several hundred cubic feet in order to lay the umbrella.
The Experiment is still running, but here are the results after 15 months. I will come back periodically to update these charts.
First, the effectiveness of the umbrella. This chart plots the moisture levels near the sensors which are placed just a little below the deepest thermal sensor (to minimize interference), at almost 11 ft. The umbrella was only about 14 ft wide and the censors were centrally located, so only about a 7ft overhang, which is probably not enough at 10 ft deep, but the experiment clearly shows that it kept the deepest sensors twice as dry as the control group. The higher sensors were probably even drier. The umbrella intended for the actual home will be ~20ft wider than the home, and will not be excavated and buried by hand.

Graphing showing that the “dry” probe had half the moisture of the “control” probe. Note the soil is very sandy and drains well anyway. I am having difficulty explaining the moisture spike between Dec 9th and 14th. I checked “WUnderground.com” and it showed some rain on the 4th and 5th of Dec, but nothing unusual. There was much more rain on the 15th of Dec, but the spike came before that. If it were a bad moisture sensor, then why did they both register the same change…? I guess you can’t always know why.
Once the effectiveness of the umbrella was established (in terms of the moisture difference between the two sensor stacks ), it was very interesting to see how little effect it had on the temperature. We noticed some difference at the 2.5 ft depth (the dry sensor was slightly less reactive to above ground temperature changes), but almost no difference for the other depths. By the 10ft deep sensor, the difference between dry and control was in the decimals and could not be seen in the chart. There was also no noticeable dip in temperature on rainy days or during the snow melt periods.
Note: this result is significant because it contradicts the theory found in many earth sheltered umbrella books!
This next chart shows the results of all the temperature probes. The erratic probe is the daily temperature fluctuations. The light blue and green curves are the 2.5ft deep probes (dry and control). These follow the air temperature the most closely, but are still very moderate compared to the air temperature fluctuations. The 5 ft probe (orange curve) is much more stable. The 7.5 ft probe is almost the same as the 10.5 ft probe. The 10.5 ft probes (dark blue lines, contrary to what is shown in the legend) are overlapping completely and can not be differentiated in this chart.
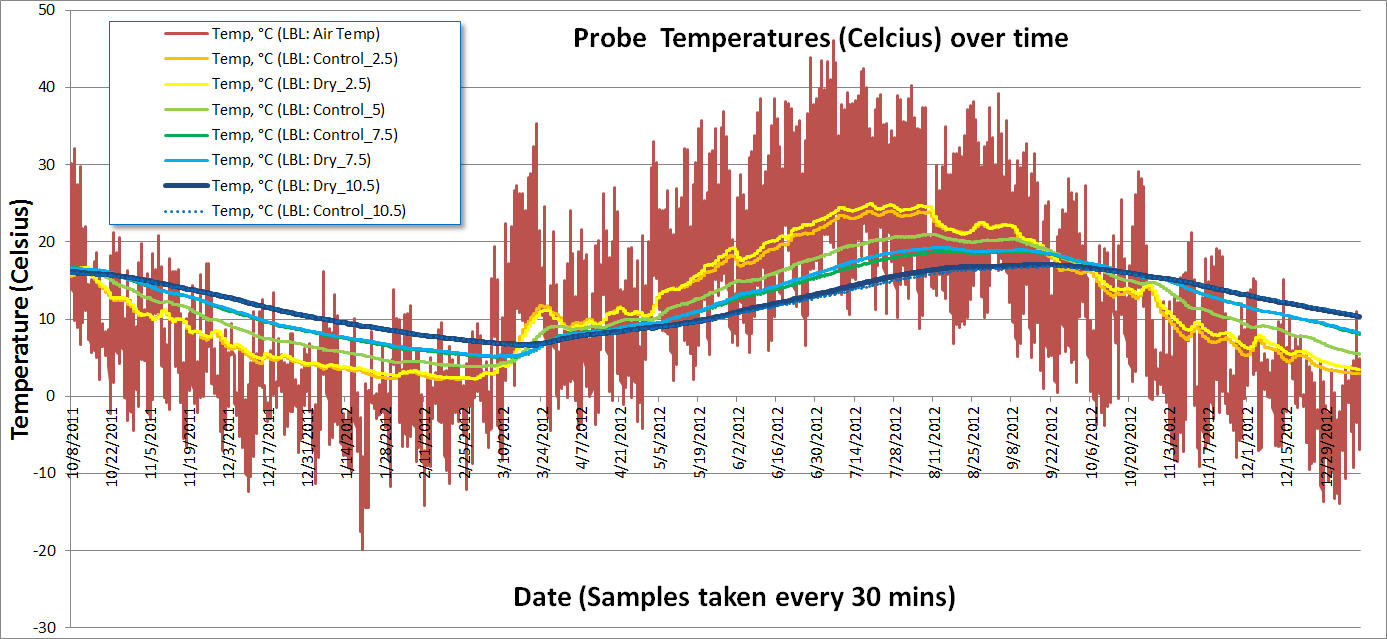
Temp Profiles of all the probes… Notice the difference between the “dry” and “control” probes is slight and may actually be due to slight variations in the depth.
This last chart shows a test of the theory that the 10.5 ft depth probe is approximately equivalent to the 6 month average air temperature. I made similar charts for all the other probes and this one is very representative. I plotted the air temperature, the probe temperature and the moving averages of the air temperature for various time frames. I plotted the one month, two month, three month, four month, five month and six month moving averages. More recently, I reduced the number of averaging lines and added the 9 month moving average. This latest update, I also added a 12 month moving average. NONE of the moving averages lined up well with any of the probe temperatures. Any ideas? I will try phase shifting the averaging (along with other transformations) or maybe a weighted exponential moving average when I have time.
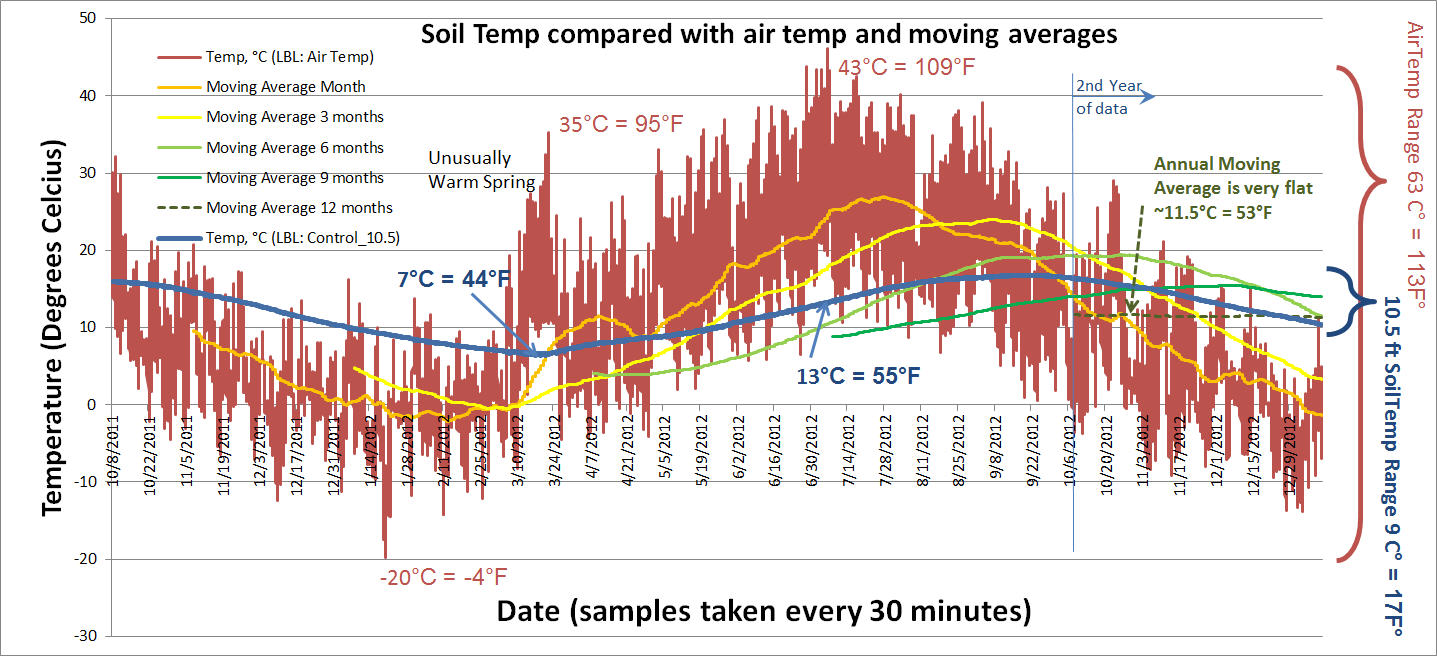
Soil temp at the 10.5ft depth, compared with moving averages…
The above chart shows that while the above ground temperature has fluctuated by 63 C° (113 F°), the temperature of the probe 10.5 ft down only fluctuated by 9 C° (17 F°). And while the ground temperature at the 10.5 ft depth doesn’t appear to match any of the moving averages, I can say that its peaks lag a little more than 3 months behind the air temp, while its amplitude is close to the 8 month moving average.
If we zoom in on a single day, you can see how widely the air temperatures vary while the underground temperatures look almost flat.

Chirstmas Day 2011 started out below freezing, but even its warmest temp was colder than the ground temperature 7.5 ft down… Of course the below ground temps barely moved during the festivities.

The First day of Summer was a hot one thanks to the early spring we got this year. However, the earth temperatures hardly moved and could even have been considered a little chilly.

In the Spring and Fall, the fluctuations can move on either side of comfortable. Here, this fall day shows ground temperatures in the comfortable range all day.
Keep in mind that it is the stability of the earth that I am after. Under natural conditions, the 10.5 ft depth appears to have floated around the 10 °C (49 °F) range. Even at its warmest, it would be considered uncomfortably chilly… But it is merely reflecting its environment. The point of the Umbrella and By-Passive solar heating will be to affect this environment to raise the average stable temperature to something closer to a comfortable room temperature and to store the summers heat to use thru the winter.
Even without the ability to warm this earth, it would be easier to heat and cool a home in this environment than in an above ground home subject to the much larger exterior temperature fluctuations, direct solar gain and air infiltration.